Share:
The year 2026 marked a new stage of growth for OnlyFans. The platform did not just increase its revenue — the very structure of spending has changed significantly over the past year. Both the platform and its audience are maturing. OnlyFans is entering new markets and testing new formats.
In this article, we break down what 2025 looked like for OnlyFans in numbers — and what conclusions about the platform’s future can be drawn from this data.
Key Figures for 2025
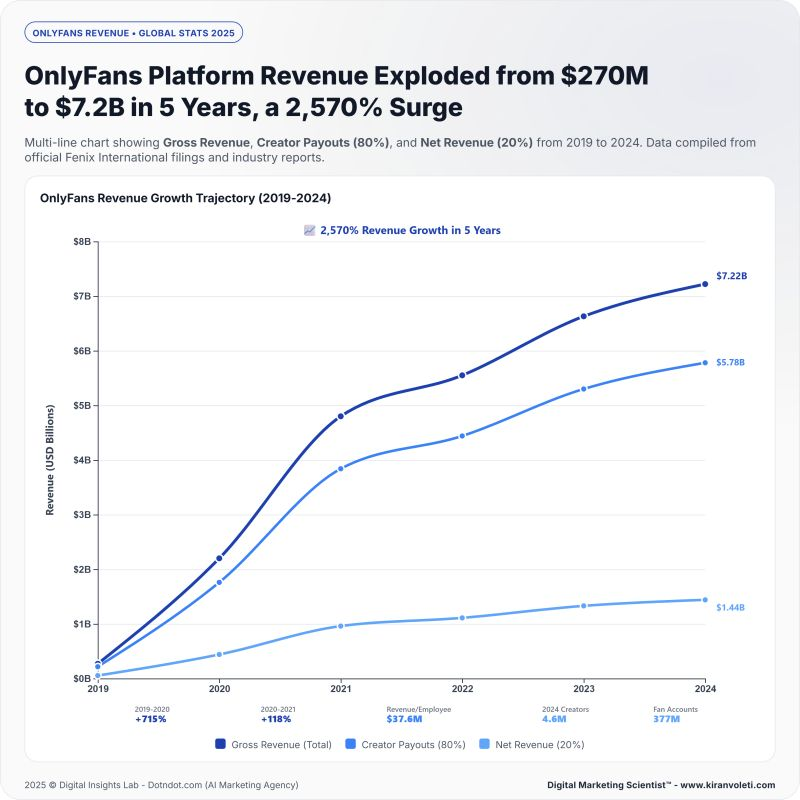
- According to the latest reports, the platform’s gross revenue reached $7.2 billion. This is 9% higher than in 2024, when revenue stood at $6.6 billion.
- The platform’s commission revenue amounted to $1.4 billion, compared to $1.3 billion in the previous reporting period. After taxes, this results in approximately $520 million in annual profit.
- The fastest-growing revenue comes from users in Southern Europe and Latin America, increasing by 20% per year or more.
- The most stable audience remains users from English-speaking countries — the United States, the United Kingdom, and Australia. Revenue growth from these countries fluctuates within 1–2%. These countries form the core of OnlyFans’ income.
- The highest spending on OnlyFans comes from users in Finland, with $127.4K per 10,000 population.
- According to the latest report, the total number of platform users in 2025 increased by 24%, reaching 377.5 million people.
- The number of creators grew by 13%, reaching approximately 4.6 million accounts.
Platform earnings and total creator income are growing year over year, although the pace has slowed compared to previous periods. Source: LinkedIn
Platform Revenue and Income
OnlyFans publishes official financial data with a delay, so the full 2025 report is not yet available. However, according to the latest information, the platform’s revenue reached $7.2 billion in 2025. Some sources suggest a higher figure of $7.9 billion.
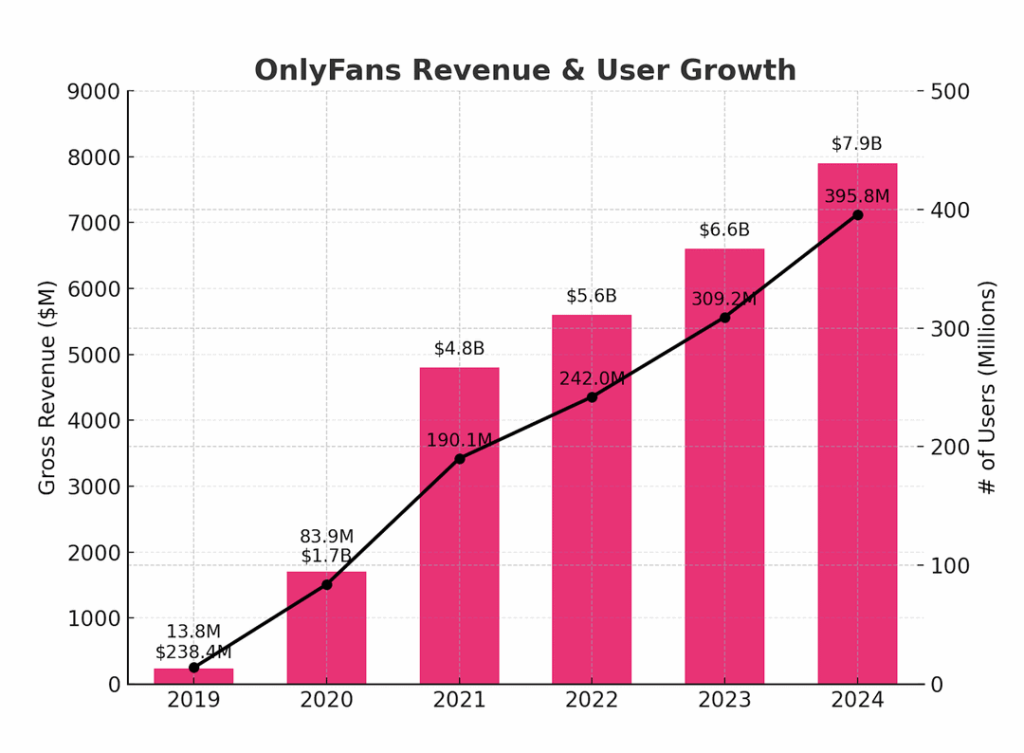
One thing remains clear: both revenue and user numbers are steadily increasing year after year. Source: ElectroIQ
This refers to gross revenue — the total amount of money users spent on the platform. 80% of this amount goes to creators, while the remaining 20% is the platform’s commission. This commission forms OnlyFans’ revenue, which reached $1.4 billion for the year.
Net profit after taxes amounted to approximately $520 million. It is also known that OnlyFans did not rely on external funding over the past year and has no outstanding debt.
Revenue Distribution by Country
The core audience generating the highest revenue for OnlyFans remains concentrated in English-speaking countries, primarily the United States and the United Kingdom.
Users from the United States spent approximately $2.6 billion on OnlyFans over the year. This equals about $77.3K per 10,000 population.
Users from the United Kingdom generated $531 million in revenue, or about $78.5K per 10,000 population.
We conducted a deeper analysis of the platform’s revenue structure across regions. The full results are available in our analytical report, but here we share the key insights by country.
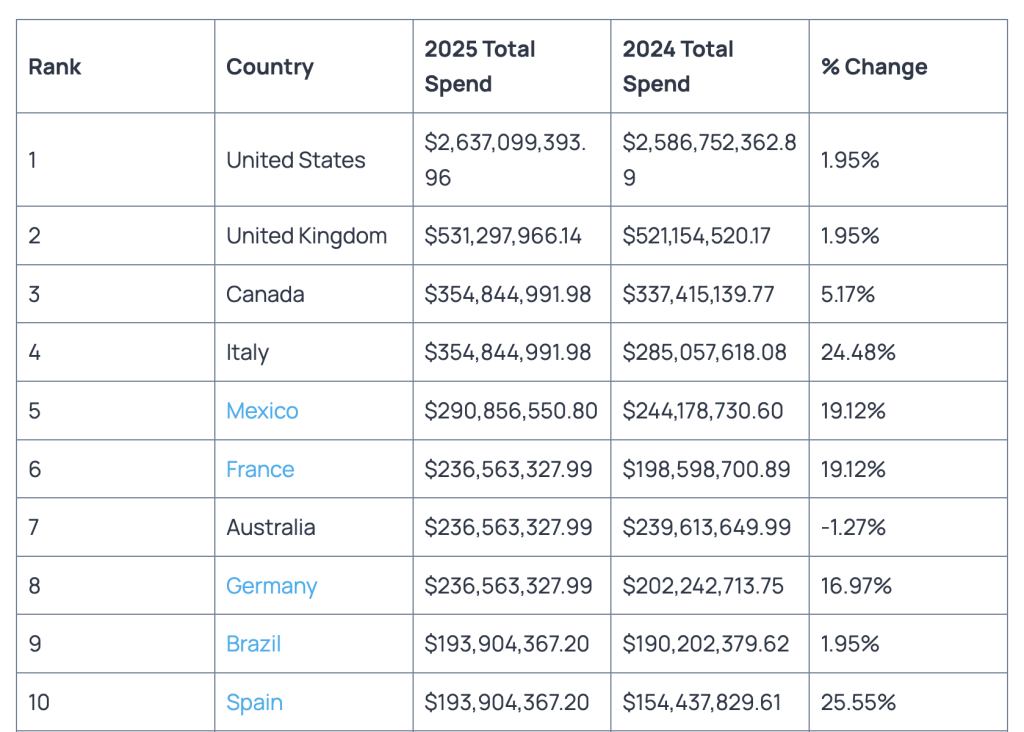
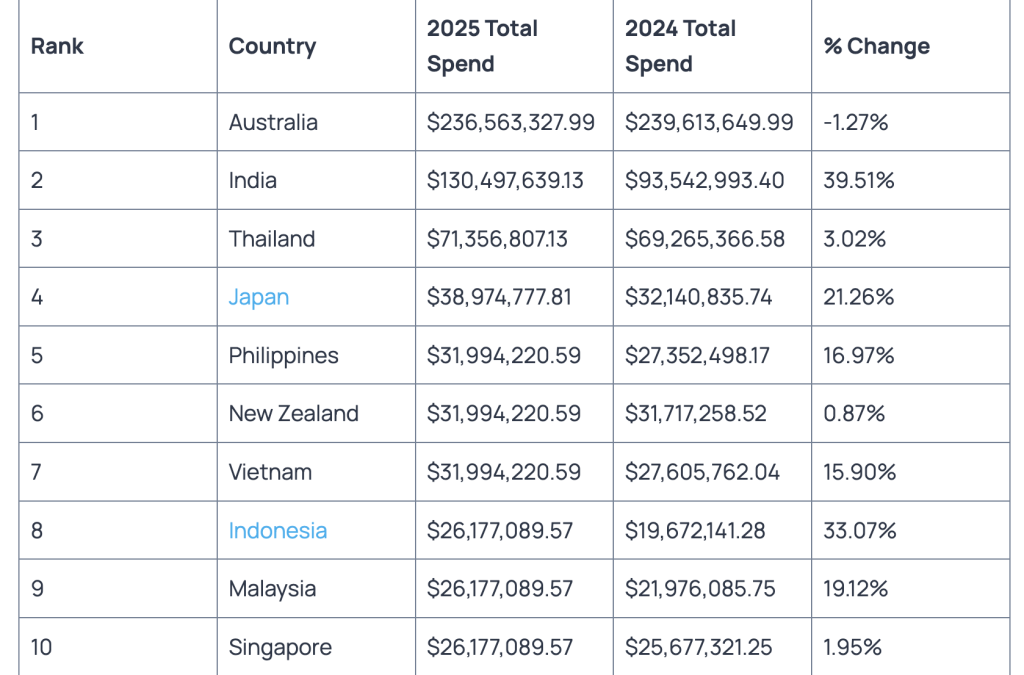
The top 10 countries by OnlyFans spending include the United States, Canada, several European and Latin American countries, as well as Australia. Source: OnlyGuider
North and South America
The United States remains the undisputed leader in total revenue. However, revenue from this market has stabilized and shows modest growth of around 1–2%, indicating a mature and saturated market.
Among American countries, Canada is also noteworthy. It ranks third in total revenue at $354.8 million, but surpasses the United States in per capita spending — $88.7K per 10,000 population. This means the average Canadian spends more on OnlyFans than the average American. Market growth over the year is about 5%.
These two markets are mature and stable, showing limited annual growth. The situation in South America is fundamentally different. In 2025, there was significant growth in revenue from Latin American countries:
- The Costa Rica market grew by 21%. While this is not the highest growth rate, spending reached $33.1K per 10,000 population, ranking third across the Americas.
- In terms of total revenue, Mexico ($290.8 million) and Brazil ($193.9 million) remain leaders. Spending in Mexico is $22.3K per 10,000 people, while Brazil does not even rank in the top 20 by per capita spending. Growth rates differ significantly: 19% for Mexico vs. 1.9% for Brazil.
- Record growth was observed in Dominica (+254%) and Grenada (+194%). However, in absolute terms, spending remains modest — no more than $11–12K per 10,000 population.
The explosive growth in small island nations has already been dubbed the “Caribbean surge.” It is associated with active tourism and the expansion of digital infrastructure.
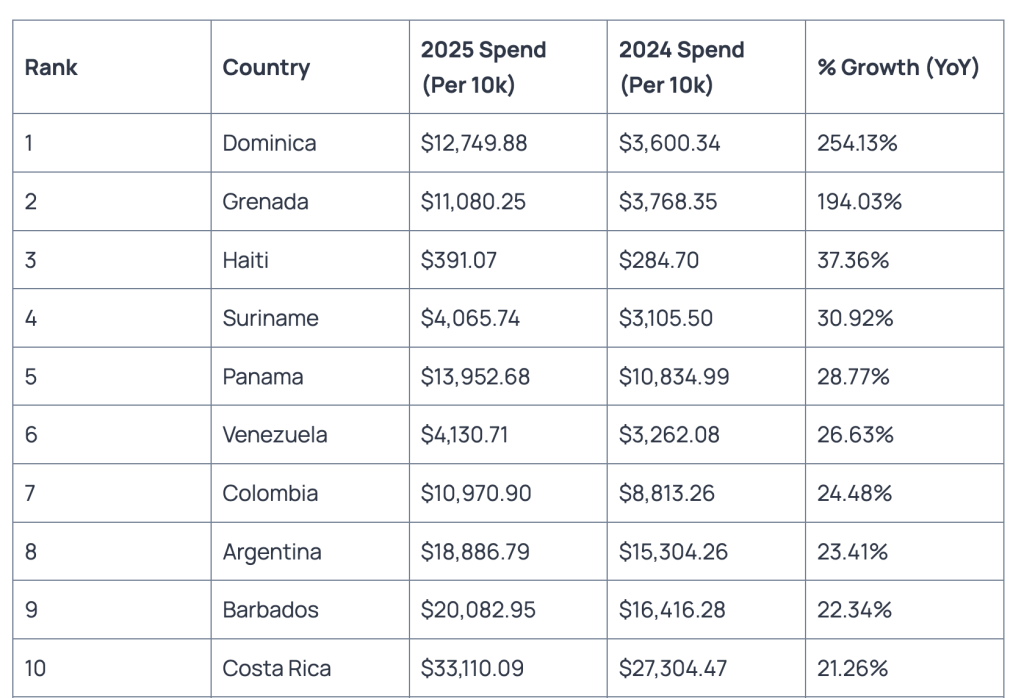
If we look at market growth rates, Caribbean countries are the clear leaders. Source: OnlyGuider
Europe
The situation here mirrors that of the Americas. The United Kingdom remains the leader in total revenue and ranks second globally among all countries with OnlyFans users. Growth in this market is modest at 1.95%. However, some dependent territories show very different dynamics — growth of 19% in Guernsey and a 12% decline in the Isle of Man.
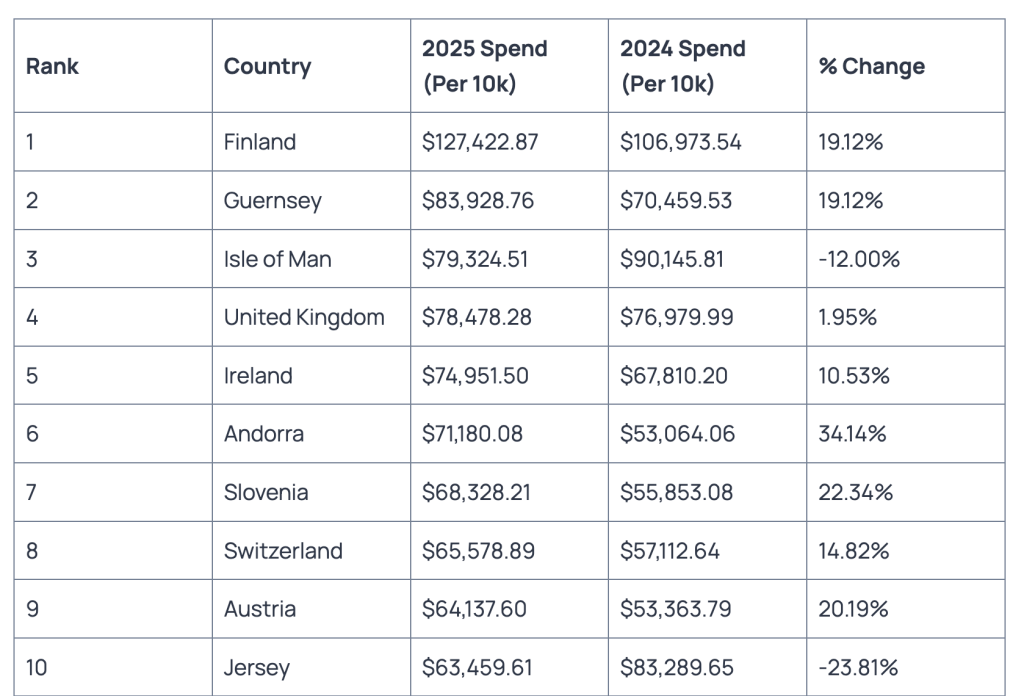
European territories with the highest per capita spending often show unstable or low growth, and sometimes even decline due to market saturation. Source: OnlyGuider
The top positions in both total revenue and per capita spending are occupied by wealthy countries with advanced banking systems — such as Switzerland and British territories like the Isle of Man and Guernsey.
Looking at other countries, we see interesting trends:
- Italy is among the top countries by total revenue, generating around $354.8 million — almost equal to Canada. At the same time, it shows strong growth of 24%.
- Finland consistently ranks first in per capita spending, with $127.4K per 10,000 population. The market is also growing at 19%, with total revenue of $71.3 million.
- Andorra recorded 34% growth, with spending of about $71.1K per 10,000 population, placing it 9th globally.
The fastest growth is observed in Balkan countries:
- San Marino: +45.9%
- Albania: +37.3%
- Bosnia and Herzegovina: +36%
The so-called “Balkan boom” is linked to digitalization — improved infrastructure and easier access to online payments.
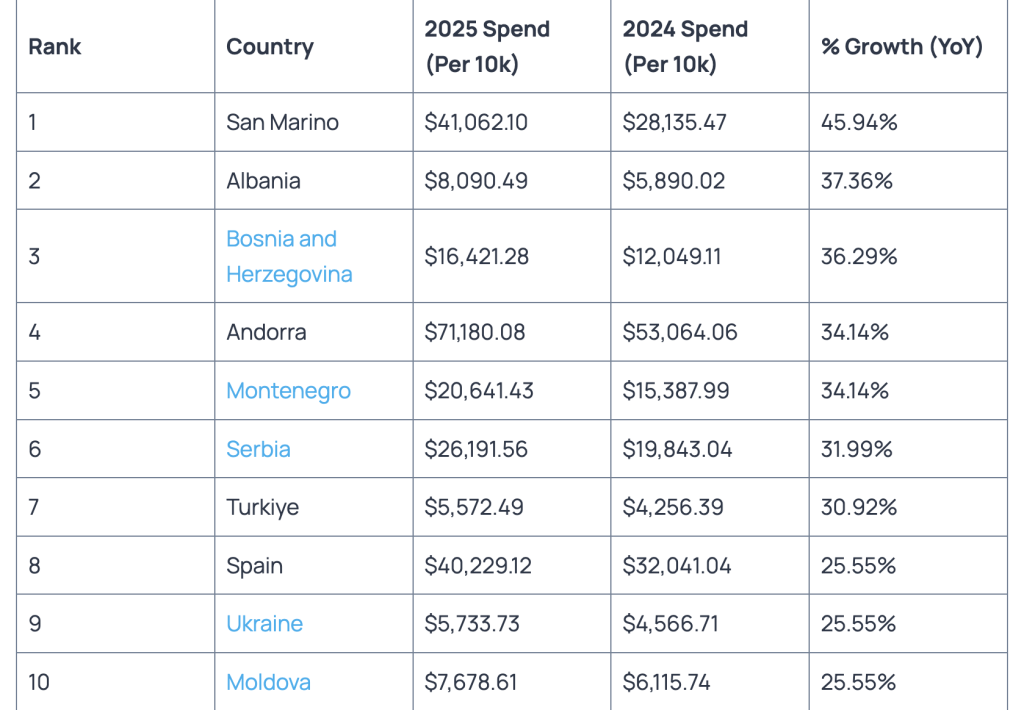
The Balkan boom shows strong growth, though not as dramatic as the Caribbean surge. Source: OnlyGuider
Middle East
This is one of the fastest-growing regions. Annual growth of 20–25% is considered average, while top performers reach 80% or more.
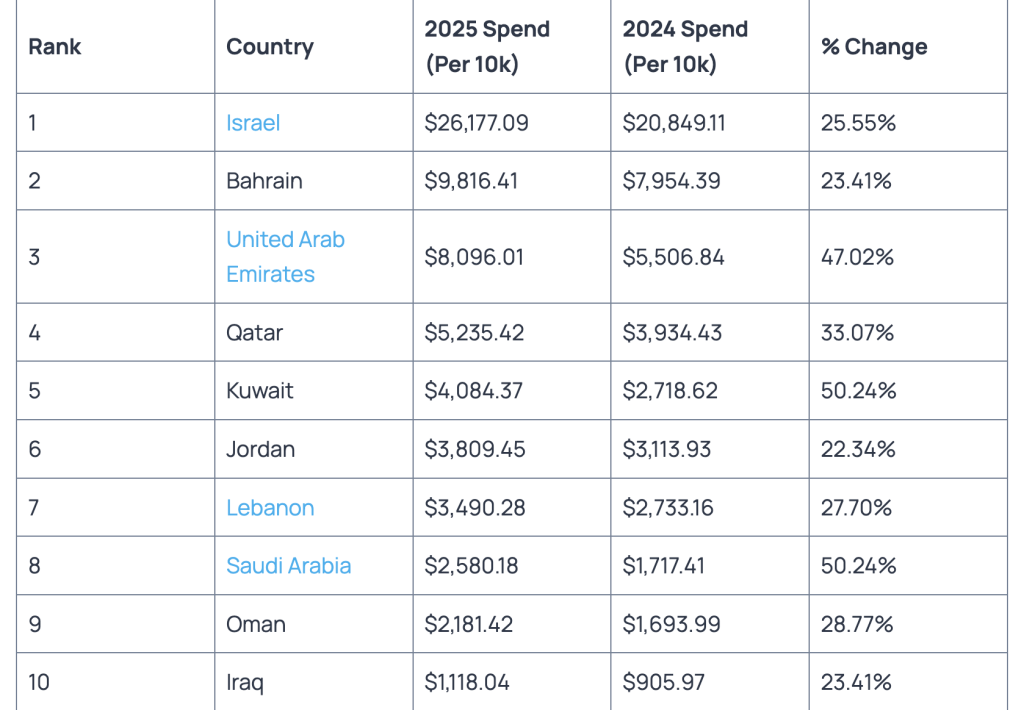
Most leaders in per capita spending come from markets growing at no less than 20% annually. Source: OnlyGuider
In terms of both total revenue and per capita spending, Israel leads the region. Its users spent $26.1 million, or $26.1K per 10,000 population, with growth of approximately 25.5%.
Second place goes to Saudi Arabia with $9.6 million and 50.2% growth, followed by the UAE with $7.8 million and 47% growth. This growth is likely linked to OnlyFans’ strict privacy policies, which allow users in conservative countries to purchase content without fear of exposure.
An unusually high growth rate was observed in Yemen: +84%, possibly due to the complex political situation and increased reliance on digital platforms.
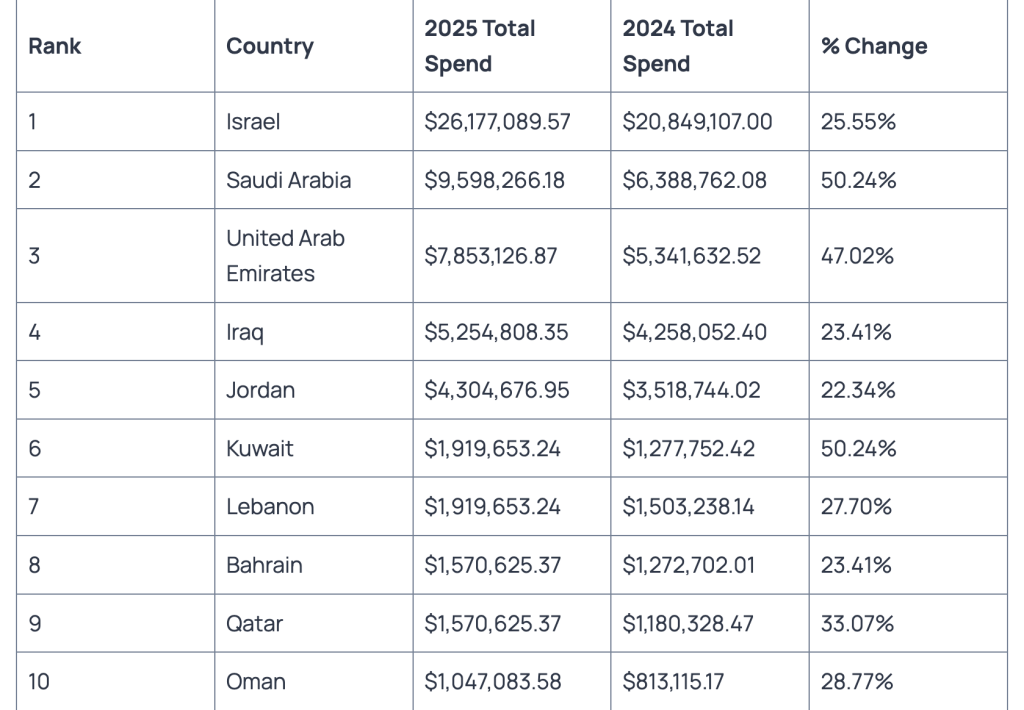
The largest revenues come from wealthy Arab countries and Israel — economies that активно use digital services. Source: OnlyGuider
Africa
This region is full of outliers — countries that significantly deviate from average metrics, likely due to major economic differences.
For example, the highest per capita spending is observed in Seychelles — $17K per 10,000 population. This is largely due to tourism, with spending driven by affluent visitors.
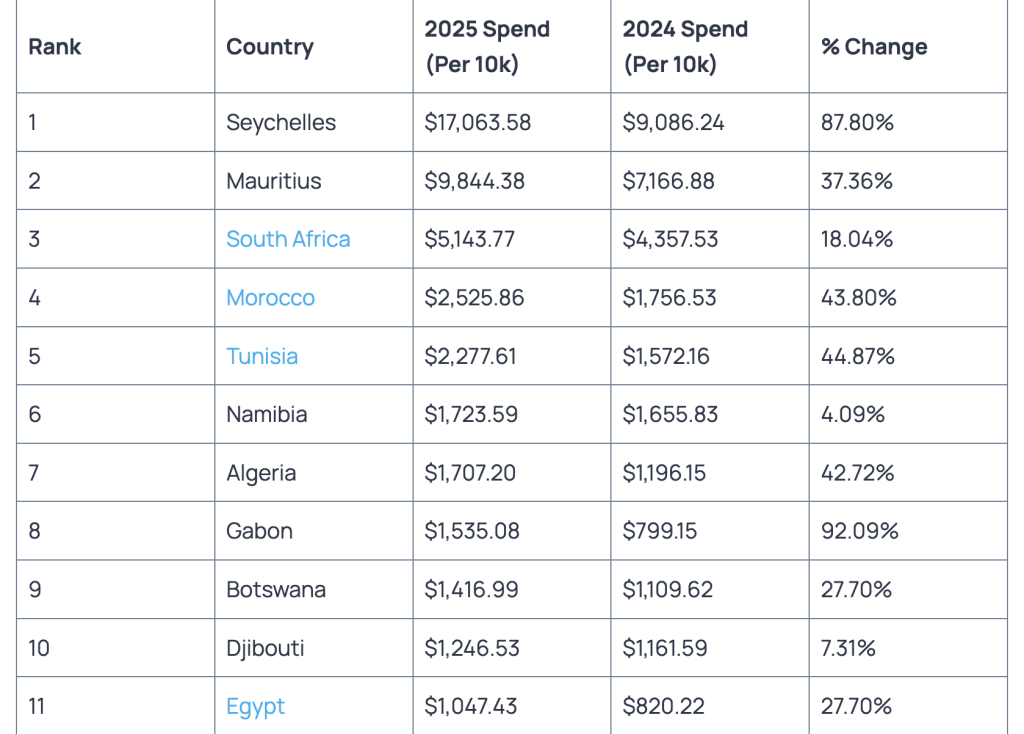
Many top per capita spenders are tourist-heavy countries, though they do not always rank high in total revenue. Source: OnlyGuider
The largest total revenues come from relatively stable and wealthier African countries:
- South Africa: nearly $32 million
- Egypt: $11.7 million
- Morocco: $9.5 million
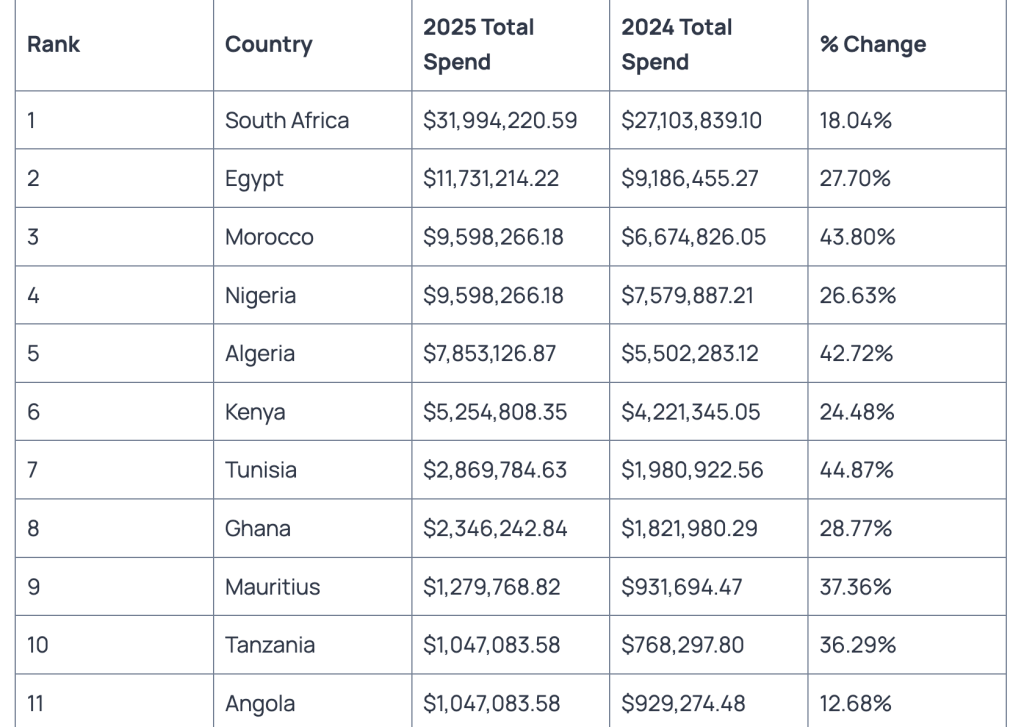
South Africa generated almost three times more revenue than Egypt. Source: OnlyGuider
Smaller countries show the same rapid growth pattern seen in the Caribbean and Balkans:
- Eswatini: +783.19%
- Burkina Faso: +446.18%
- Burundi: +314.38%
Similar trends (over 100% growth) are observed in Mali and Sudan. The reason is the same: increasing accessibility of digital services. However, spending per 10,000 population remains very low — under $800, and in some cases below $100.
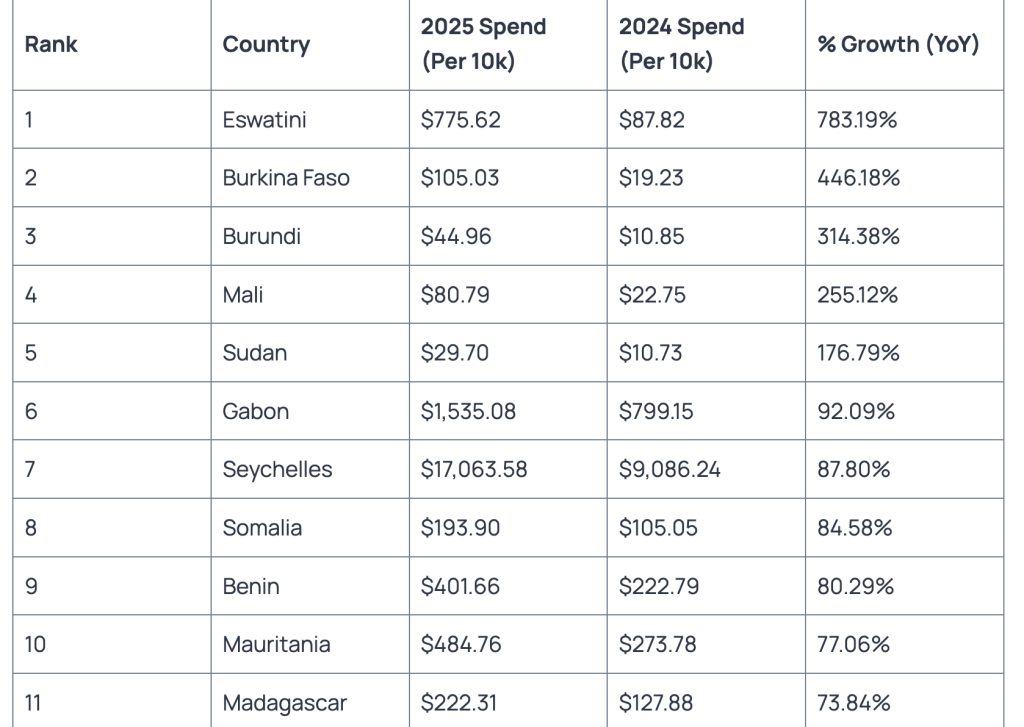
Despite impressive growth rates, absolute spending remains minimal. Seychelles is the main exception. Source: OnlyGuider
Asia-Pacific Region
The leading countries are Australia and New Zealand. Their situation resembles that of developed European markets: slow growth but high revenue.
- Australians spent $236.5 million, or $88.6K per 10,000 population, but the market declined by 1.27%.
- In New Zealand, spending reached $60.3K per 10,000 population, totaling nearly $32 million, with growth of just 0.87%.
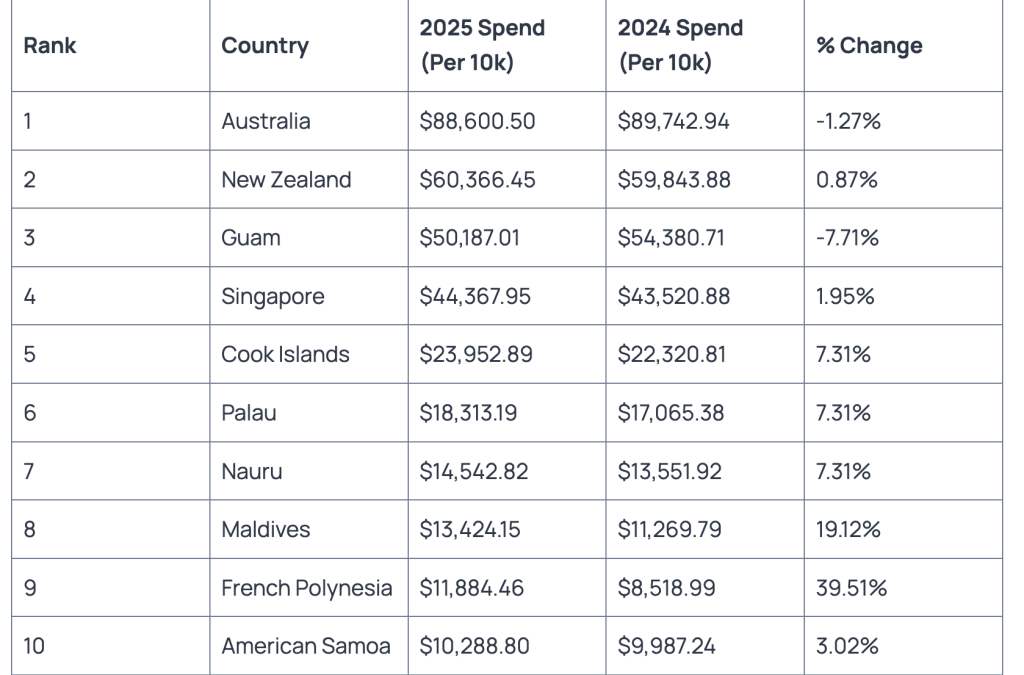
New Zealand ranks among leaders in per capita spending but generates less total revenue than countries like India. Source: OnlyGuider
This is typical behavior for saturated markets. A similar situation is seen in Singapore, with 1.95% growth and $44.3K per 10,000 population.
In absolute terms, Australia remains the leader, but rapidly growing markets are catching up.
For example: India generated $130.5 million in revenue, with growth of 39.5%. However, due to its large population, it does not rank in the top 20 by per capita spending.
India has moved into second place globally by total revenue, making it a strategically important market. Source: OnlyGuider
Some countries — such as Bhutan, Afghanistan, and Turkmenistan — show growth above 100%, though from a very low base. The record holder is Timor-Leste (+302%), with spending of just $290 per 10,000 population.
Markets like China, Japan, and South Korea are growing, but slower than expected, likely due to competition from local platforms.
Platform Audience: Structure, Demographics, and Ratios
The OnlyFans audience continues to grow — both creators and fans — though at a slower pace than in previous years. This is a natural transition toward market maturity.
The platform now has 377.5 million users, and this number continues to increase monthly. At the same time, the number of creators is growing faster than the number of fans.
The largest age group is 25–34, accounting for 35.52% of users. The second largest is 18–24, at 24.68%.
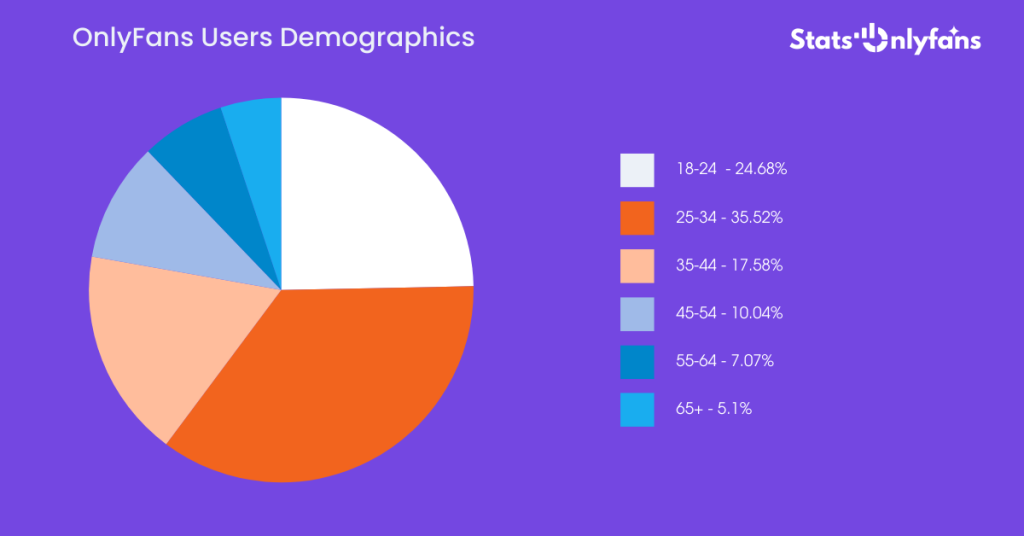
Users aged 65+ represent the smallest segment on the platform. Source: OnlyFans Statistics
Creators
According to the latest data, there are approximately 4.66 million creators on OnlyFans. Their number grows by about 29.4% annually. However, the platform approves only about 36% of creator applications.
- Approximately 84% of creators are women, 14% are men, and 2% identify as non-binary or do not specify gender.
- The average female creator is 29 years old, while the average male creator is 32. Most creators fall within the 20–40 age range.
- The largest number of creators is based in the United States (about 1.1 million), followed by the United Kingdom (280,000). Significant numbers are also found in Canada, Australia, Germany, and Brazil.
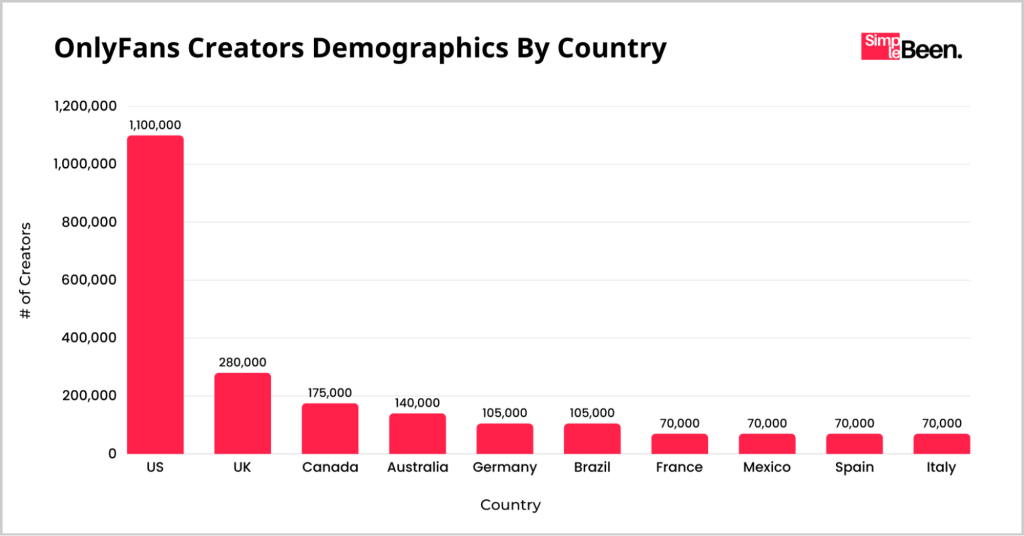
The United States leads by a wide margin in the number of OnlyFans creators. Source: SimpleBeen
The ratio of creators to fans has changed significantly over time — from 87:1 in 2021 to 74:1 in 2025. Despite this shift, creators still make up only 1.3% of the total user base.
Fans
Fans account for 98.7% of OnlyFans users. Their demographic structure is the opposite of creators:
- 78.9% are men
- About 21% are women
The average fan is older than the average creator — around 32 years old.
Geographically, distribution mirrors that of creators: about 47% of users are from the United States, and 14% from the United Kingdom.
More than 85% of fans actively use the platform — subscribing, liking, and commenting. However, most users subscribe to only a small number of creators:
- 35% have no more than one subscription
- 33% have 2–3 subscriptions
- 22% have fewer than 6 subscriptions
- 10% have more than 6 subscriptions
Spending Structure
Up to 95.8% of users do not make purchases, consuming only free content. The majority of revenue comes from the remaining 4.2%, with just 0.01% of users generating up to 20.2% of total income.
- The average paying fan spends about $48.52 per creator, totaling several hundred dollars per year.
- Most spending comes from subscriptions, PPV content, tips, and exclusive messages. The latter account for about 69.7% of creators’ income, although only 17.19% of fans engage in direct messaging.
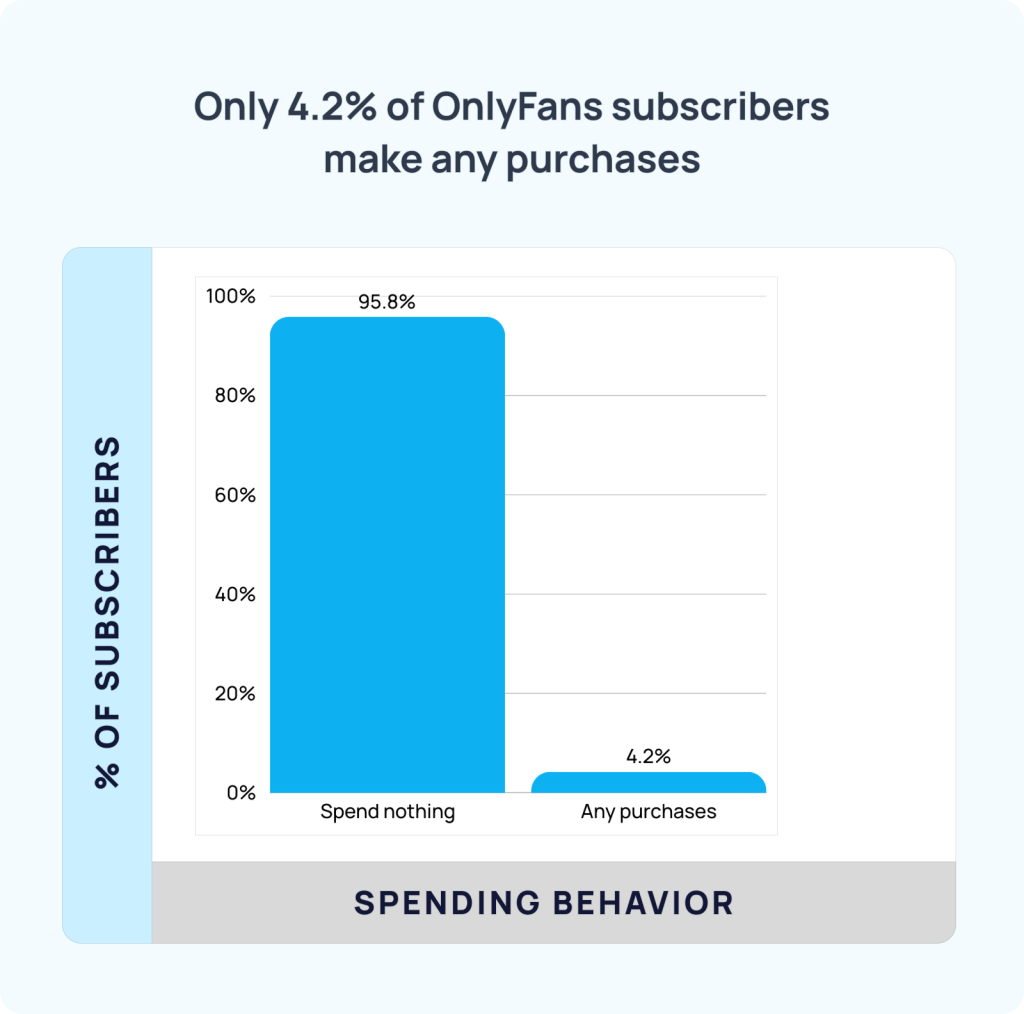
Most users do not purchase paid content at all. Source: OnlyGuider
Most purchases occur within the first 48 hours after subscribing. After that, spending drops sharply, often to zero.
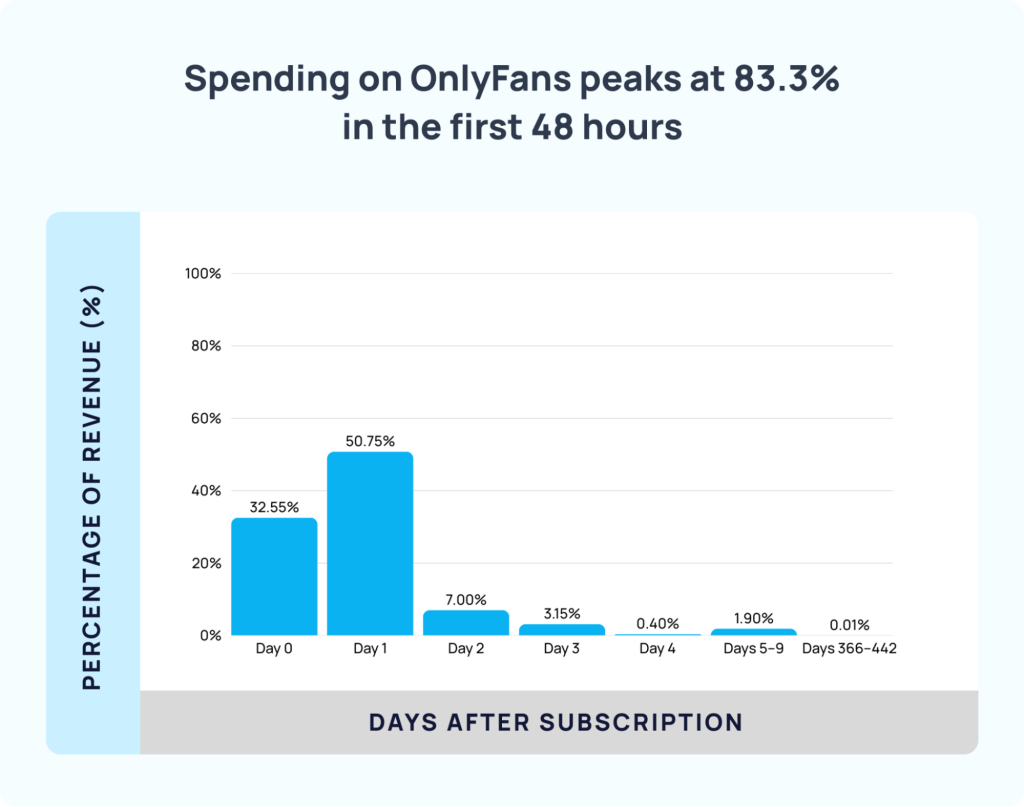
83% of spending occurs within the first two days after subscription. Source: OnlyGuider
On weekends, users spend more than on weekdays. About 29.7% of total spending occurs on Saturdays and Sundays.
Creator Earnings: Peak and Average Figures
According to our internal data, more than 76% of total income is earned by the top 0.1% of creators, with an average income of $146.9K per month.
Other studies report different figures, but all agree on one point: top creators control a significant share of revenue.
- The top 1% of creators earns about $49K per year, while the top 0.1% earns many times more.
- Some creators — such as Blac Chyna — can earn millions of dollars annually after platform fees.
However, these are exceptions. On average, a creator earns about $131 per month, or roughly $1.5K per year after commission.
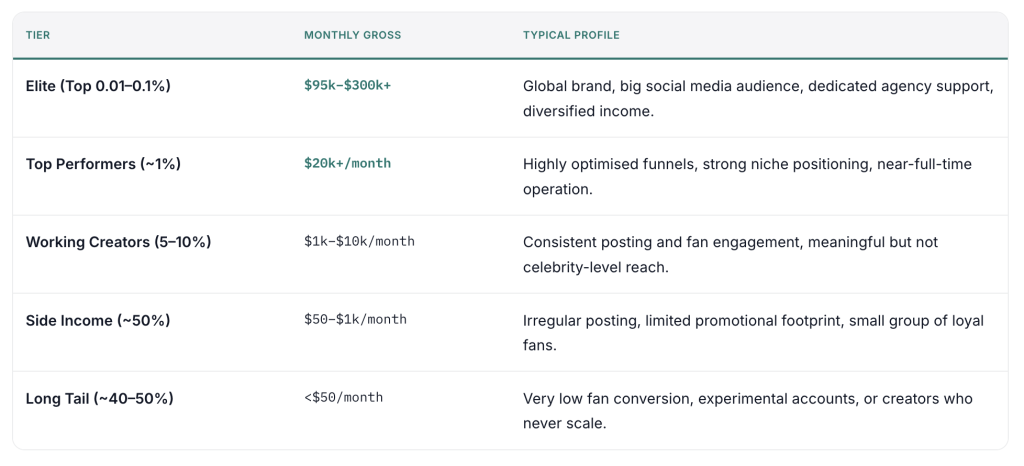
This is what the distribution of creators by income percentile looks like. The lower 50% mostly consists of inactive or irregular accounts. Source: Inside the Porn
On average, creators earn about $2.06 per fan, including both paying and non-paying users.
Conclusions and Forecast
In 2025, OnlyFans began transitioning from explosive growth to a phase of stable maturity. The number of users continues to grow, but at a slower pace — typical for platforms at this stage.
In developed markets, growth is likely to shift from expansion to deeper monetization. Payment models will become more flexible, and content more diverse. This trend is already visible, with OnlyFans actively promoting new formats, including collaborations with athletes and creative initiatives.
At the same time, newer markets — particularly in Latin America, the Balkans, and Asia — are expected to continue growing.
However, the platform’s core revenue will still rely on users from the United States and the United Kingdom.
Author
Want more paying OnlyFans subscribers?
Launch a campaign in 24 hours and fill your creators’ pages with real fans, not freebie hunters.
Recent partner average: $4.24 back per $1 spent • 324% ROMI
Real people only. No bots, no spam traffic sources.
ONLY FOR ONLYFANS AGENCIES, MODELS, AND MARKETERS
Want to promote your OnlyFans profile?
Start getting paying subscribers from search. Launch in 48 hours.
Recent partner average: $4.24 back per $1 • 324% ROMI