Share:
OnlyFans is a global platform — and America is losing the trade war…. to the tune of almost $1 Billion a year.
U.S. consumers spent $2.63 billion on OnlyFans in 2025. But American creators earned back only $1.68 billion. The remaining $950 million didn’t stay in the United States — it flowed to creators in the UK, Australia, Brazil and beyond. America, as a country, is a massive net importer of OnlyFans content, sending nearly a billion dollars more to foreign creators than its own creators bring home.
That’s the global picture. But Onlyguider’s analysis reveals a second, equally striking story playing out within America’s own borders.
Onlyguider, the leading OnlyFans search engine, has conducted the first comprehensive balance of trade analysis of OnlyFans spending and creator revenue across every U.S. state and 160+ cities. Drawing on its proprietary “OnlyFans Wrapped 2025” dataset — the most detailed publicly available picture of the platform’s geographic economics — Onlyguider calculated, for every state and major city, how much residents spend on OnlyFans versus how much local creators earn back from the platform.
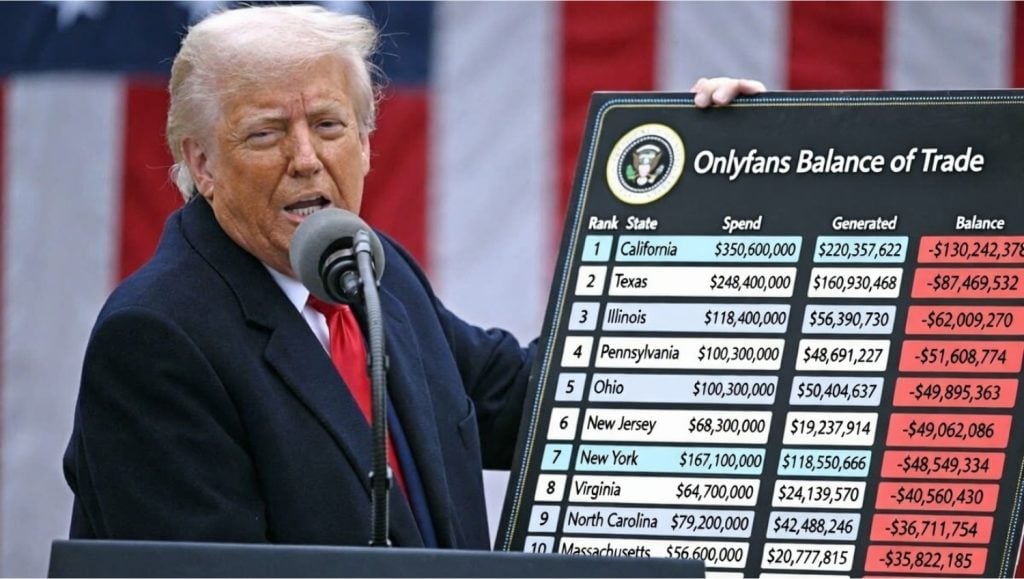
Of the $1.68 billion that American creators do earn, it is distributed with staggering inequality. A small cluster of cities — Las Vegas, Los Angeles, Miami, Atlanta, New York — capture the overwhelming majority. Meanwhile states like California (-$130.2M), Texas (-$87.5M) and Illinois (-$62M) see their residents spend hundreds of millions on OnlyFans while local creators earn back a fraction of it, with the balance absorbed by those creator hubs.
“There are really two deficits here,” said Sam Pierce, CEO of Onlyguider. “America is losing almost a billion dollars to overseas creators — that’s the international trade story. But then within the U.S., you have this second redistribution where a handful of cities are capturing the creator economy while the rest of the country funds them. States like Illinois and New Jersey are losing on both fronts — sending money overseas and sending money to LA and Las Vegas.”
What has Onlyguider calculated?
For each state and city, Onlyguider calculated:
- Annual Spend: Total dollars spent by residents on OnlyFans content
- Annual Generated: Total revenue earned by creators based in that location
- Balance: The difference — positive figures indicate a net surplus (more earned locally than spent); negative figures indicate a net deficit (more spent than earned locally)
National-level figures ($2.63B spend, $1.68B generated) are drawn from Onlyguider’s top-line OnlyFans Wrapped 2025 analysis. State and city figures are drawn from the constituent geographic breakdown within the same dataset.
Key Findings
America has a near-$950 million OnlyFans deficit. U.S. residents spent $2.63 billion on OnlyFans in 2025 but American creators earned back only $1.68 billion — with the remainder flowing to creators outside the United States.
Within the U.S., creator revenue is acutely concentrated. The state and city data reveals a domestic redistribution sitting on top of the international one. Just 3 states run a surplus. Only 16 cities in the entire dataset are net positive. Creator revenue pools in a small number of high-density markets while the rest of the country funds them.
Large, wealthy states lose the most in absolute terms. California runs an internal deficit of -$130.2M. Texas is -$87.5M. Illinois -$62M. These are not struggling states — they are America’s economic powerhouses, and they are the biggest net exporters of OnlyFans revenue to other U.S. markets.
Creator density is the single most reliable predictor of surplus or deficit. Nevada has 1,648 creators per 100,000 residents and a $37.6M surplus. New Jersey has just 155 creators per 100,000 and a -$49M deficit. Cities above roughly 130 creators per 10,000 residents tend to run surpluses. Below that threshold, deficits are almost universal.
Major cities frequently rescue their states — but can’t always close the gap. Los Angeles generates a +$40.8M surplus, but California still runs -$130.2M because the rest of the state bleeds heavily. New York City posts +$11.4M; New York State is -$48.5M. Without LA, California’s deficit would be approximately $171 million.
“The creator economy was supposed to democratise income,” said Pierce. “What the data shows is that it has largely replicated the same geographic inequality we see across every other major industry — money flows to the entertainment hubs, and everywhere else is the audience. The difference is that with OnlyFans, we can now measure it precisely.”
Table 1: Top 10 States — Largest Surplus to Lowest Deficit
| Rank | State | Annual Spend | Annual Generated | Balance |
| 1 | Nevada | $32,400,000 | $70,011,260 | +$37,611,260 |
| 2 | District of Columbia | $9,100,000 | $14,423,014 | +$5,323,014 |
| 3 | Alaska | $5,100,000 | $5,118,543 | +$18,543 |
| 4 | Hawaii | $12,200,000 | $10,844,371 | -$1,355,629 |
| 5 | Tennessee | $36,300,000 | $34,116,392 | -$2,183,608 |
| 6 | Florida | $159,600,000 | $157,004,806 | -$2,595,194 |
| 7 | Wyoming | $5,100,000 | $2,385,762 | -$2,714,238 |
| 8 | Vermont | $4,900,000 | $2,125,497 | -$2,774,503 |
| 9 | Montana | $7,500,000 | $4,229,305 | -$3,270,695 |
| 10 | Oregon | $36,000,000 | $32,272,849 | -$3,727,151 |
Table 2: Top 10 States — Largest Deficit
| Rank | State | Annual Spend | Annual Generated | Balance |
| 1 | California | $350,600,000 | $220,357,622 | -$130,242,378 |
| 2 | Texas | $248,400,000 | $160,930,468 | -$87,469,532 |
| 3 | Illinois | $118,400,000 | $56,390,730 | -$62,009,270 |
| 4 | Pennsylvania | $100,300,000 | $48,691,227 | -$51,608,773 |
| 5 | Ohio | $100,300,000 | $50,404,637 | -$49,895,363 |
| 6 | New Jersey | $68,300,000 | $19,237,914 | -$49,062,086 |
| 7 | New York | $167,100,000 | $118,550,666 | -$48,549,334 |
| 8 | Virginia | $64,700,000 | $24,139,570 | -$40,560,430 |
| 9 | North Carolina | $79,200,000 | $42,488,246 | -$36,711,754 |
| 10 | Massachusetts | $56,600,000 | $20,777,815 | -$35,822,185 |
Table 3: Top 10 Cities — Largest Surplus
| Rank | City | State | Annual Spend | Annual Generated | Balance |
| 1 | Las Vegas | Nevada | $17,544,933 | $61,791,227 | +$44,246,294 |
| 2 | Los Angeles | California | $71,342,933 | $112,109,109 | +$40,766,176 |
| 3 | Miami | Florida | $17,544,933 | $51,987,915 | +$34,442,982 |
| 4 | Atlanta | Georgia | $26,172,000 | $50,599,836 | +$24,427,836 |
| 5 | New York City | New York | $87,240,000 | $98,683,778 | +$11,443,778 |
| 6 | Houston | Texas | $31,988,000 | $39,842,220 | +$7,854,220 |
| 7 | Portland | Oregon | $11,728,933 | $17,502,815 | +$5,773,882 |
| 8 | Washington DC | District of Columbia | $9,105,066 | $14,423,014 | +$5,317,948 |
| 9 | Dallas | Texas | $26,172,000 | $30,776,325 | +$4,604,325 |
| 10 | San Francisco | California | $11,728,933 | $16,266,557 | +$4,537,624 |
Table 4: Top 10 Cities — Largest Deficit
| Rank | City | State | Annual Spend | Annual Generated | Balance |
| 1 | San Antonio | Texas | $17,387,250 | $5,834,272 | -$11,552,978 |
| 2 | Phoenix | Arizona | $22,811,166 | $12,861,424 | -$9,949,742 |
| 3 | San Jose | California | $11,728,933 | $2,060,431 | -$9,668,502 |
| 4 | Minneapolis | Minnesota | $14,346,133 | $6,116,225 | -$8,229,908 |
| 5 | Fort Worth | Texas | $10,241,583 | $2,559,272 | -$7,682,311 |
| 6 | Chicago | Illinois | $47,691,200 | $39,863,908 | -$7,827,292 |
| 7 | Denver | Colorado | $21,325,333 | $14,227,815 | -$7,097,518 |
| 8 | Saint Paul | Minnesota | $6,529,716 | $195,199 | -$6,334,517 |
| 9 | Cleveland | Ohio | $11,316,666 | $4,793,212 | -$6,523,454 |
| 10 | Columbus | Ohio | $11,155,000 | $4,359,437 | -$6,795,563 |
Interesting Findings
Nevada: America’s Creator Capital
Nevada is the most efficient creator state in the country by a significant margin. With 1,648 creators per 100,000 residents — more than ten times New Jersey’s density — it generates $70M against $32.4M in spend, a +$37.6M surplus. Las Vegas alone accounts for the lion’s share: spending $17.5M, generating $61.8M — a +$44.2M surplus that actually exceeds Los Angeles’s +$40.8M. A market ranked #40 nationally outperforming the #2 DMA in creator returns. The entertainment infrastructure, the culture of performance and content creation, and a population entirely comfortable with adult content economics has made Nevada the OnlyFans equivalent of a net energy exporter.
California: The “NewCum” State (#sorrynotsorry)
California has more creators than any other state — approximately 169,500. It still runs a -$130.2M deficit, the worst in America. The reason: 39 million people spending heavily on a platform where creator density (429 per 100,000), while above average nationally, cannot absorb that volume of spend. Los Angeles is a genuine surplus city (+$40.8M) and San Francisco contributes a modest surplus (+$4.5M). But San Diego (-$6.4M), San Jose (-$9.7M) and Fresno (-$3.1M) drag the state deep into deficit. Without LA, California’s shortfall would be approximately $171M.
“California is the perfect illustration of the concentration dynamic,” said Pierce. “It has more creators than anywhere else, but they’re almost all in LA. The rest of this enormous state is effectively exporting money to those creators — and to creators in other states entirely.”
Chicago: The Giant That Underperforms
Chicago spends $47.7M on OnlyFans — more than Miami and Las Vegas combined — and still runs a -$7.8M deficit. Notably, Chicago’s per capita spend ($173,650 per 10,000 residents) is almost identical to Los Angeles ($178,447) — Chicagoans are spending at virtually the same rate as Angelenos. The difference isn’t appetite, it’s creators: LA has 215 creators per 10,000 residents, Chicago has just 111. Not a single satellite city in the Chicago DMA runs a surplus. Aurora, Joliet, Rockford and Naperville are all deficit markets with creator densities in single digits.
Phoenix: The Biggest Loser in the Top 20
The #11 U.S. media market runs a -$9.9M deficit. Phoenix has 59 creators per 10,000 residents — the lowest density of any major metro in the top 15 DMAs. Scottsdale, Mesa and Chandler — three of the wealthiest suburbs in America — add further deficit without meaningful creator economies. Phoenix’s rapid population growth has created a vast new spending base with almost no corresponding creator culture.
The Military Markets
Two of the most striking deficit markets — San Antonio and Norfolk — share a common thread: large military populations. San Antonio (29 creators per 10,000) runs a -$11.6M deficit despite being a top-10 U.S. city by population. Norfolk, covering Virginia Beach, Newport News and Chesapeake, runs a -$8M deficit across the DMA. Large concentrations of military personnel appear to drive significant OnlyFans spending with almost no local creator economy to match it.
Table 5: All States — Complete Balance of Onlyfans Trade
Ranked: largest surplus to largest deficit
| Rank | State | Annual Spend | Annual Generated | Balance | Creators | Creators per 100k |
| 1 | Nevada | $32,400,000 | $70,011,260 | +$37,611,260 | 53,855 | 1,648 |
| 2 | District of Columbia | $9,100,000 | $14,423,014 | +$5,323,014 | 11,095 | 1,580 |
| 3 | Alaska | $5,100,000 | $5,118,543 | +$18,543 | 3,937 | 532 |
| 4 | Hawaii | $12,200,000 | $10,844,371 | -$1,355,629 | 8,342 | 577 |
| 5 | Tennessee | $36,300,000 | $34,116,392 | -$2,183,608 | 26,243 | 363 |
| 6 | Florida | $159,600,000 | $157,004,806 | -$2,595,194 | 120,773 | 517 |
| 7 | Wyoming | $5,100,000 | $2,385,762 | -$2,714,238 | 1,835 | 312 |
| 8 | Vermont | $4,900,000 | $2,125,497 | -$2,774,503 | 1,635 | 252 |
| 9 | Montana | $7,500,000 | $4,229,305 | -$3,270,695 | 3,253 | 286 |
| 10 | Oregon | $36,000,000 | $32,272,849 | -$3,727,151 | 24,825 | 581 |
| 11 | South Dakota | $6,900,000 | $2,494,205 | -$4,405,795 | 1,919 | 207 |
| 12 | Maine | $11,400,000 | $6,810,265 | -$4,589,735 | 5,239 | 373 |
| 13 | Delaware | $6,700,000 | $2,103,808 | -$4,596,192 | 1,618 | 154 |
| 14 | Rhode Island | $7,600,000 | $2,949,669 | -$4,650,331 | 2,269 | 204 |
| 15 | Georgia | $87,400,000 | $82,634,108 | -$4,765,892 | 63,565 | 569 |
| 16 | North Dakota | $8,600,000 | $2,646,027 | -$5,953,973 | 2,035 | 256 |
| 17 | Louisiana | $26,400,000 | $20,192,219 | -$6,207,781 | 15,532 | 338 |
| 18 | West Virginia | $13,000,000 | $6,224,669 | -$6,775,331 | 4,788 | 271 |
| 19 | Arkansas | $16,700,000 | $9,543,047 | -$7,156,953 | 7,341 | 238 |
| 20 | Idaho | $12,700,000 | $5,422,186 | -$7,277,814 | 4,171 | 208 |
| 21 | New Hampshire | $12,500,000 | $4,034,106 | -$8,465,894 | 3,103 | 220 |
| 22 | Mississippi | $13,700,000 | $5,161,921 | -$8,538,079 | 3,971 | 135 |
| 23 | Nebraska | $15,900,000 | $6,181,292 | -$9,718,708 | 4,755 | 237 |
| 24 | Washington | $73,100,000 | $61,465,896 | -$11,634,104 | 47,281 | 594 |
| 25 | Utah | $24,100,000 | $12,340,894 | -$11,759,106 | 9,493 | 271 |
| 26 | Oklahoma | $29,500,000 | $17,654,636 | -$11,845,364 | 13,580 | 332 |
| 27 | Kentucky | $30,100,000 | $17,437,749 | -$12,662,251 | 13,414 | 292 |
| 28 | Kansas | $22,000,000 | $8,328,477 | -$13,671,523 | 6,407 | 216 |
| 29 | New Mexico | $19,700,000 | $5,812,583 | -$13,887,417 | 4,471 | 210 |
| 30 | Colorado | $56,600,000 | $42,531,624 | -$14,068,376 | 32,717 | 549 |
| 31 | Alabama | $30,000,000 | $15,485,762 | -$14,514,238 | 11,912 | 231 |
| 32 | Iowa | $28,000,000 | $11,169,702 | -$16,830,298 | 8,592 | 265 |
| 33 | Missouri | $46,300,000 | $29,062,915 | -$17,237,085 | 22,356 | 358 |
| 34 | South Carolina | $36,000,000 | $16,678,643 | -$19,321,357 | 12,830 | 234 |
| 35 | Connecticut | $27,300,000 | $7,244,040 | -$20,055,960 | 5,572 | 152 |
| 36 | Arizona | $70,400,000 | $48,474,339 | -$21,925,661 | 37,288 | 492 |
| 37 | Wisconsin | $45,600,000 | $20,517,550 | -$25,082,450 | 15,783 | 265 |
| 38 | Maryland | $43,200,000 | $17,307,616 | -$25,892,384 | 13,314 | 213 |
| 39 | Minnesota | $47,900,000 | $20,777,815 | -$27,122,185 | 15,983 | 276 |
| 40 | Indiana | $56,600,000 | $25,072,186 | -$31,527,814 | 19,286 | 279 |
| 41 | Michigan | $82,000,000 | $47,389,902 | -$34,610,098 | 36,454 | 359 |
| 42 | Massachusetts | $56,600,000 | $20,777,815 | -$35,822,185 | 15,983 | 224 |
| 43 | North Carolina | $79,200,000 | $42,488,246 | -$36,711,754 | 32,683 | 296 |
| 44 | Virginia | $64,700,000 | $24,139,570 | -$40,560,430 | 18,569 | 211 |
| 45 | New York | $167,100,000 | $118,550,666 | -$48,549,334 | 91,193 | 459 |
| 46 | New Jersey | $68,300,000 | $19,237,914 | -$49,062,086 | 14,798 | 156 |
| 47 | Ohio | $100,300,000 | $50,404,637 | -$49,895,363 | 38,773 | 326 |
| 48 | Pennsylvania | $100,300,000 | $48,691,227 | -$51,608,773 | 37,455 | 286 |
| 49 | Illinois | $118,400,000 | $56,390,730 | -$62,009,270 | 43,377 | 341 |
| 50 | Texas | $248,400,000 | $160,930,468 | -$87,469,532 | 123,793 | 396 |
| 51 | California | $350,600,000 | $220,357,622 | -$130,242,378 | 169,506 | 430 |
Table 6: All Cities — Complete Balance of Onlyfans Trade
Ranked: largest surplus to largest deficit. Cities with spend data but no matching revenue data are excluded from ranking.
| Rank | City | State | Annual Spend | Annual Generated | Balance | Creators | Creators per 10k |
| 1 | Las Vegas | Nevada | $17,544,933 | $61,791,227 | +$44,246,294 | 47,532 | 700.61 |
| 2 | Los Angeles | California | $71,342,933 | $112,109,109 | +$40,766,176 | 86,238 | 215.70 |
| 3 | Miami | Florida | $17,544,933 | $51,987,915 | +$34,442,982 | 39,991 | 854.57 |
| 4 | Atlanta | Georgia | $26,172,000 | $50,599,836 | +$24,427,836 | 38,923 | 781.49 |
| 5 | New York City | New York | $87,240,000 | $98,683,778 | +$11,443,778 | 75,911 | 86.22 |
| 6 | Houston | Texas | $31,988,000 | $39,842,220 | +$7,854,220 | 30,648 | 132.99 |
| 7 | Portland | Oregon | $11,728,933 | $17,502,815 | +$5,773,882 | 13,464 | 206.34 |
| 8 | Washington | District of Columbia | $9,105,066 | $14,423,014 | +$5,317,948 | 11,095 | 157.99 |
| 9 | Dallas | Texas | $26,172,000 | $30,776,325 | +$4,604,325 | 23,674 | 182.10 |
| 10 | San Francisco | California | $11,728,933 | $16,266,557 | +$4,537,624 | 12,513 | 141.52 |
| 11 | Kansas City | Kansas | $3,276,983 | $7,048,841 | +$3,771,858 | 5,422 | 346.23 |
| 12 | Tampa | Florida | $8,668,566 | $12,405,961 | +$3,737,395 | 9,543 | 247.90 |
| 13 | Columbus | Georgia | $1,320,816 | $4,359,437 | +$3,038,621 | 3,353 | 167.41 |
| 14 | Seattle | Washington | $21,325,333 | $23,987,749 | +$2,662,416 | 18,452 | 249.33 |
| 15 | New Orleans | Louisiana | $5,253,786 | $7,569,371 | +$2,315,585 | 5,823 | 151.67 |
| 16 | Memphis | Tennessee | $3,099,150 | $4,598,013 | +$1,498,863 | 3,537 | 55.87 |
| 17 | Paradise | Nevada | $640,200 | $433,775 | -$206,425 | 334 | 13.80 |
| 18 | Pittsburgh | Pennsylvania | $7,763,233 | $7,482,616 | -$280,617 | 5,756 | 190.29 |
| 19 | Detroit | Michigan | $10,977,166 | $10,670,861 | -$306,305 | 8,208 | 128.43 |
| 20 | Chattanooga | Tennessee | $1,348,300 | $1,019,371 | -$328,929 | 784 | 43.30 |
| 21 | Sandy | Utah | $357,283 | $21,689 | -$335,594 | 17 | 1.54 |
| 22 | Columbia | Maryland | $493,083 | $43,377 | -$449,706 | 33 | 3.20 |
| 23 | Provo | Utah | $504,400 | $43,377 | -$461,023 | 33 | 2.90 |
| 24 | Tuscaloosa | Alabama | $596,550 | $130,132 | -$466,418 | 100 | 10.05 |
| 25 | Kansas City | Missouri | $7,523,966 | $7,048,841 | -$475,125 | 5,422 | 106.61 |
| 26 | Clarksville | Tennessee | $965,150 | $477,152 | -$487,998 | 367 | 22.61 |
| 27 | Huntsville | Alabama | $1,251,300 | $737,417 | -$513,883 | 567 | 26.38 |
| 28 | Olathe | Kansas | $591,700 | $65,066 | -$526,634 | 50 | 2.72 |
| 29 | Edison | New Jersey | $565,833 | $21,689 | -$544,144 | 17 | 1.55 |
| 30 | Fayetteville | Arkansas | $919,883 | $347,020 | -$572,863 | 267 | 28.41 |
| 31 | Reno | Nevada | $2,470,266 | $1,865,232 | -$605,034 | 1,435 | 56.26 |
| 32 | Montgomery | Alabama | $1,068,616 | $455,464 | -$613,152 | 350 | 17.47 |
| 33 | South Bend | Indiana | $882,700 | $260,265 | -$622,435 | 200 | 19.43 |
| 34 | Shreveport | Louisiana | $1,015,266 | $390,397 | -$624,869 | 300 | 15.99 |
| 35 | Meridian | Idaho | $677,383 | $43,377 | -$634,006 | 33 | 2.90 |
| 36 | Rochester | Minnesota | $787,316 | $151,821 | -$635,495 | 117 | 10.54 |
| 37 | Lansing | Michigan | $1,117,116 | $477,152 | -$639,964 | 367 | 32.11 |
| 38 | Allentown | Pennsylvania | $1,002,333 | $347,020 | -$655,313 | 267 | 21.34 |
| 39 | Augusta | Georgia | $1,440,450 | $759,106 | -$681,344 | 584 | 29.03 |
| 40 | Columbia | Missouri | $1,073,466 | $368,709 | -$704,757 | 284 | 23.04 |
| 41 | Knoxville | Tennessee | $2,441,166 | $1,735,099 | -$706,067 | 1,335 | 72.28 |
| 42 | Lowell | Massachusetts | $756,600 | $43,377 | -$713,223 | 33 | 3.00 |
| 43 | Lawton | Oklahoma | $811,566 | $86,755 | -$724,811 | 67 | 7.37 |
| 44 | Stamford | Connecticut | $842,283 | $108,444 | -$733,839 | 83 | 6.16 |
| 45 | Savannah | Georgia | $2,515,533 | $1,778,477 | -$737,056 | 1,368 | 92.87 |
| 46 | Topeka | Kansas | $932,816 | $195,199 | -$737,617 | 150 | 11.70 |
| 47 | Broken Arrow | Oklahoma | $795,400 | $43,377 | -$752,023 | 33 | 2.95 |
| 48 | North Charleston | South Carolina | $795,400 | $43,377 | -$752,023 | 33 | 3.18 |
| 49 | Norman | Oklahoma | $908,566 | $151,821 | -$756,745 | 117 | 9.54 |
| 50 | Evansville | Indiana | $1,238,366 | $477,152 | -$761,213 | 367 | 30.99 |
| 51 | Charleston | South Carolina | $2,654,566 | $1,886,921 | -$767,645 | 1,451 | 105.53 |
| 52 | Columbia | South Carolina | $1,747,616 | $954,305 | -$793,311 | 734 | 54.62 |
| 53 | St. Louis | Missouri | $7,895,800 | $7,092,219 | -$803,581 | 5,456 | 180.90 |
| 54 | Greensboro | North Carolina | $1,935,150 | $1,127,815 | -$807,335 | 868 | 29.01 |
| 55 | Sterling Heights | Michigan | $834,200 | $21,689 | -$812,511 | 17 | 1.27 |
| 56 | Independence | Missouri | $944,133 | $130,132 | -$814,001 | 100 | 8.63 |
| 57 | Naperville | Illinois | $915,033 | $65,066 | -$849,967 | 50 | 3.33 |
| 58 | Cedar Rapids | Iowa | $1,172,083 | $281,954 | -$890,129 | 217 | 15.90 |
| 59 | Baton Rouge | Louisiana | $1,935,150 | $1,041,060 | -$894,090 | 801 | 36.34 |
| 60 | Norfolk | Virginia | $2,135,616 | $1,214,570 | -$921,046 | 934 | 39.25 |
| 61 | Paterson | New Jersey | $1,049,216 | $108,444 | -$940,772 | 83 | 5.22 |
| 62 | Billings | Montana | $1,028,200 | $86,755 | -$941,445 | 67 | 5.70 |
| 63 | Jackson | Mississippi | $1,375,783 | $433,775 | -$942,008 | 334 | 22.60 |
| 64 | Springfield | Massachusetts | $1,181,783 | $238,576 | -$943,207 | 184 | 11.99 |
| 65 | Tulsa | Oklahoma | $2,834,016 | $1,886,921 | -$947,095 | 1,451 | 30.96 |
| 66 | St. Petersburg | Florida | $1,841,383 | $889,238 | -$952,145 | 684 | 26.48 |
| 67 | Worcester | Massachusetts | $1,391,950 | $433,775 | -$958,175 | 334 | 18.03 |
| 68 | Eugene | Oregon | $1,435,600 | $433,775 | -$1,001,825 | 334 | 17.61 |
| 69 | Nampa | Idaho | $1,096,100 | $65,066 | -$1,031,034 | 50 | 4.70 |
| 70 | Bellevue | Washington | $1,248,066 | $195,199 | -$1,052,867 | 150 | 10.31 |
| 71 | Erie | Pennsylvania | $1,367,700 | $303,642 | -$1,064,058 | 234 | 23.98 |
| 72 | Green Bay | Wisconsin | $1,411,350 | $347,020 | -$1,064,330 | 267 | 25.65 |
| 73 | Spokane | Washington | $2,308,600 | $1,236,258 | -$1,072,342 | 951 | 41.53 |
| 74 | Kenosha | Wisconsin | $1,120,350 | $43,377 | -$1,076,973 | 33 | 3.36 |
| 75 | Rio Rancho | New Mexico | $1,147,833 | $65,066 | -$1,082,767 | 50 | 5.51 |
| 76 | Akron | Ohio | $1,941,616 | $845,861 | -$1,095,755 | 651 | 34.08 |
| 77 | Waterbury | Connecticut | $1,193,100 | $86,755 | -$1,106,345 | 67 | 5.83 |
| 78 | Lafayette | Louisiana | $1,592,416 | $477,152 | -$1,115,264 | 367 | 24.17 |
| 79 | Carmel | Indiana | $1,164,000 | $43,377 | -$1,120,623 | 33 | 3.34 |
| 80 | Aurora | Illinois | $1,513,200 | $390,397 | -$1,122,803 | 300 | 14.37 |
| 81 | Bridgeport | Connecticut | $1,149,450 | $21,689 | -$1,127,761 | 17 | 1.12 |
| 82 | Rockford | Illinois | $1,377,400 | $238,576 | -$1,138,824 | 184 | 13.09 |
| 83 | Winston-Salem | North Carolina | $1,610,200 | $455,464 | -$1,154,736 | 350 | 14.04 |
| 84 | Nashville | Tennessee | $9,596,400 | $8,436,921 | -$1,159,479 | 6,490 | 93.72 |
| 85 | Sioux Falls | South Dakota | $1,553,616 | $390,397 | -$1,163,219 | 300 | 15.06 |
| 86 | Newport News | Virginia | $1,362,850 | $195,199 | -$1,167,651 | 150 | 8.34 |
| 87 | Richmond | Virginia | $3,629,416 | $2,429,139 | -$1,200,277 | 1,869 | 82.46 |
| 88 | Las Cruces | New Mexico | $1,332,133 | $130,132 | -$1,202,001 | 100 | 8.91 |
| 89 | Fort Collins | Colorado | $1,532,600 | $325,331 | -$1,207,269 | 250 | 14.91 |
| 90 | Little Rock | Arkansas | $1,965,866 | $737,417 | -$1,228,449 | 567 | 28.00 |
| 91 | Warren | Michigan | $1,307,883 | $65,066 | -$1,242,817 | 50 | 3.73 |
| 92 | Toledo | Ohio | $2,184,116 | $910,927 | -$1,273,189 | 701 | 25.87 |
| 93 | Salem | Oregon | $1,948,083 | $628,974 | -$1,319,109 | 484 | 27.56 |
| 94 | Madison | Wisconsin | $2,083,883 | $759,106 | -$1,324,777 | 584 | 21.64 |
| 95 | Anchorage | Alaska | $2,106,516 | $780,795 | -$1,325,721 | 601 | 20.60 |
| 96 | Joliet | Illinois | $1,484,100 | $151,821 | -$1,332,279 | 117 | 7.92 |
| 97 | New Haven | Connecticut | $1,542,300 | $195,199 | -$1,347,102 | 150 | 11.20 |
| 98 | Hartford | Connecticut | $1,918,983 | $563,907 | -$1,355,076 | 434 | 35.83 |
| 99 | Providence | Rhode Island | $2,054,783 | $672,351 | -$1,382,432 | 517 | 27.18 |
| 100 | Springfield | Missouri | $2,184,116 | $759,106 | -$1,425,010 | 584 | 34.37 |
| 101 | Cambridge | Massachusetts | $1,513,200 | $43,377 | -$1,469,823 | 33 | 2.82 |
| 102 | Boise | Idaho | $2,281,116 | $780,795 | -$1,500,321 | 601 | 25.48 |
| 103 | Vancouver | Washington | $1,930,300 | $412,086 | -$1,518,214 | 317 | 16.88 |
| 104 | Durham | North Carolina | $1,873,716 | $347,020 | -$1,526,696 | 267 | 9.42 |
| 105 | Fargo | North Dakota | $1,948,083 | $390,397 | -$1,557,685 | 300 | 23.87 |
| 106 | Manchester | New Hampshire | $1,786,416 | $195,199 | -$1,591,217 | 150 | 13.05 |
| 107 | Syracuse | New York | $2,328,000 | $715,729 | -$1,612,272 | 551 | 37.93 |
| 108 | Des Moines | Iowa | $2,433,083 | $802,483 | -$1,630,600 | 617 | 24.90 |
| 109 | North Las Vegas | Nevada | $1,868,866 | $173,510 | -$1,695,356 | 133 | 5.51 |
| 110 | Rochester | New York | $3,280,216 | $1,583,278 | -$1,696,938 | 1,218 | 57.84 |
| 111 | Chesapeake | Virginia | $2,112,983 | $281,954 | -$1,831,029 | 217 | 8.93 |
| 112 | Overland Park | Kansas | $1,909,283 | $65,066 | -$1,844,217 | 50 | 2.62 |
| 113 | Jersey City | New Jersey | $2,696,600 | $845,861 | -$1,850,739 | 651 | 23.89 |
| 114 | Lexington | Kentucky | $2,777,433 | $889,238 | -$1,888,195 | 684 | 21.21 |
| 115 | Chandler | Arizona | $2,062,866 | $173,510 | -$1,889,356 | 133 | 5.19 |
| 116 | Mobile | Alabama | $2,476,733 | $563,907 | -$1,912,826 | 434 | 23.19 |
| 117 | Lakewood | Colorado | $1,988,500 | $65,066 | -$1,923,434 | 50 | 3.19 |
| 118 | Newark | New Jersey | $2,728,933 | $759,106 | -$1,969,827 | 584 | 20.58 |
| 119 | Scottsdale | Arizona | $3,925,266 | $1,908,609 | -$2,016,657 | 1,468 | 57.51 |
| 120 | Wichita | Kansas | $3,170,283 | $997,682 | -$2,172,601 | 767 | 19.29 |
| 121 | Fort Wayne | Indiana | $2,851,800 | $628,974 | -$2,222,826 | 484 | 18.33 |
| 122 | Tacoma | Washington | $3,386,916 | $1,106,126 | -$2,280,790 | 851 | 38.79 |
| 123 | Henderson | Nevada | $2,627,083 | $303,642 | -$2,323,441 | 234 | 7.30 |
| 124 | Orlando | Florida | $14,346,133 | $11,755,298 | -$2,590,835 | 9,043 | 294.00 |
| 125 | Honolulu | Hawaii | $5,310,750 | $2,602,649 | -$2,708,101 | 2,002 | 57.17 |
| 126 | Philadelphia | Pennsylvania | $17,544,933 | $14,835,100 | -$2,709,833 | 11,412 | 71.15 |
| 127 | Grand Rapids | Michigan | $3,603,550 | $824,172 | -$2,779,378 | 634 | 31.87 |
| 128 | Louisville | Kentucky | $6,634,800 | $3,795,530 | -$2,839,270 | 2,920 | 46.11 |
| 129 | Fresno | California | $4,478,166 | $1,409,768 | -$3,068,398 | 1,084 | 20.46 |
| 130 | Aurora | Colorado | $3,470,983 | $390,397 | -$3,080,586 | 300 | 8.03 |
| 131 | Boston | Massachusetts | $14,346,133 | $11,061,259 | -$3,284,874 | 8,509 | 125.95 |
| 132 | Birmingham | Alabama | $4,830,600 | $1,474,834 | -$3,355,766 | 1,134 | 57.42 |
| 133 | Milwaukee | Wisconsin | $7,329,966 | $3,947,351 | -$3,382,615 | 3,036 | 51.05 |
| 134 | Colorado Springs | Colorado | $5,050,466 | $1,583,278 | -$3,467,188 | 1,218 | 25.17 |
| 135 | Cincinnati | Ohio | $7,944,300 | $4,294,371 | -$3,649,929 | 3,303 | 106.79 |
| 136 | Austin | Texas | $17,544,933 | $13,880,795 | -$3,664,138 | 10,678 | 109.08 |
| 137 | Oklahoma City | Oklahoma | $7,307,333 | $3,513,576 | -$3,793,757 | 2,703 | 39.68 |
| 138 | Mesa | Arizona | $4,504,033 | $607,285 | -$3,896,748 | 467 | 9.18 |
| 139 | Charlotte | North Carolina | $11,728,933 | $7,742,881 | -$3,986,052 | 5,956 | 68.10 |
| 140 | Buffalo | New York | $6,802,933 | $2,776,159 | -$4,026,774 | 2,136 | 76.72 |
| 141 | Virginia Beach | Virginia | $5,558,100 | $1,496,523 | -$4,061,577 | 1,151 | 25.36 |
| 142 | Tucson | Arizona | $5,897,600 | $1,691,722 | -$4,205,878 | 1,301 | 23.83 |
| 143 | Omaha | Nebraska | $6,175,666 | $1,648,344 | -$4,527,322 | 1,268 | 26.23 |
| 144 | Jacksonville | Florida | $9,151,950 | $4,446,192 | -$4,705,758 | 3,420 | 36.02 |
| 145 | Salt Lake City | Utah | $8,232,066 | $3,513,576 | -$4,718,490 | 2,703 | 135.28 |
| 146 | Baltimore | Maryland | $11,728,933 | $6,962,086 | -$4,766,847 | 5,355 | 90.26 |
| 147 | Indianapolis | Indiana | $10,419,416 | $5,443,874 | -$4,975,542 | 4,188 | 43.02 |
| 148 | Raleigh | North Carolina | $7,523,966 | $2,233,940 | -$5,290,026 | 1,718 | 33.77 |
| 149 | Albuquerque | New Mexico | $7,452,833 | $1,604,967 | -$5,847,866 | 1,235 | 22.03 |
| 150 | Saint Paul | Minnesota | $6,529,716 | $195,199 | -$6,334,517 | 150 | 4.82 |
| 151 | San Diego | California | $21,325,333 | $14,878,477 | -$6,446,856 | 11,445 | 80.26 |
| 152 | Cleveland | Ohio | $11,316,666 | $4,793,212 | -$6,523,454 | 3,687 | 98.95 |
| 153 | Columbus | Ohio | $11,155,000 | $4,359,437 | -$6,795,563 | 3,353 | 38.29 |
| 154 | Denver | Colorado | $21,325,333 | $14,227,815 | -$7,097,518 | 10,944 | 152.17 |
| 155 | Fort Worth | Texas | $10,241,583 | $2,559,272 | -$7,682,311 | 1,969 | 21.42 |
| 156 | Chicago | Illinois | $47,691,200 | $39,863,908 | -$7,827,292 | 30,665 | 111.65 |
| 157 | Minneapolis | Minnesota | $14,346,133 | $6,116,225 | -$8,229,908 | 4,705 | 110.61 |
| 158 | San Jose | California | $11,728,933 | $2,060,431 | -$9,668,502 | 1,585 | 15.39 |
| 159 | Phoenix | Arizona | $22,811,166 | $12,861,424 | -$9,949,742 | 9,893 | 59.59 |
| 160 | San Antonio | Texas | $17,387,250 | $5,834,272 | -$11,552,978 | 4,488 | 29.01 |
Methodology
Data sources:
Onlyguider’s OnlyFans Wrapped 2025 report.
Onlyguider’s U.S Onlyfans State & City Spend report
Onlyguider’s U.S Onlyfans Creator Census report
All figures represent 2025 annual totals. Balance of trade = Annual Generated minus Annual Spend. Positive figures indicate a net surplus; negative figures indicate a net deficit. Seven cities in the spend dataset had no matching creator revenue data and have been excluded from the ranked table.
Copyright & Attribution
The 2026 U.S OnlyFans Balance of Trade Report © 2025 by Onlyguider is licensed under CC BY 4.0
Author
Want more paying OnlyFans subscribers?
Launch a campaign in 24 hours and fill your creators’ pages with real fans, not freebie hunters.
Recent partner average: $4.24 back per $1 spent • 324% ROMI
Real people only. No bots, no spam traffic sources.
ONLY FOR ONLYFANS AGENCIES, MODELS, AND MARKETERS
Want to promote your OnlyFans profile?
Start getting paying subscribers from search. Launch in 48 hours.
Recent partner average: $4.24 back per $1 • 324% ROMI